Pitts Trader
Wednesday, January 16, 2019
The Start of a New Trend? Technical Analysis January 2019
For the first time since the 2009 bottom, the SPY or S&P 500 has experienced a lower low. This means a few things. 1.) The market has broken support 2.) There is now resistance ahead. (Old support now becomes new resistance.) This old support was $260 on $SPY, which is now new resistance.
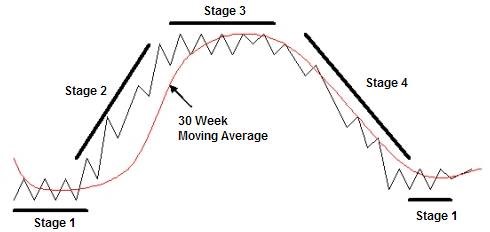
The stock market has 4 different phases. 1. Accumulation 2. Run-up 3. Distribution 4. Run-down.
(See below)
The above was taken from Next Big Trade. I do not trade with the 30 week moving average, but hopefully this paints a clear picture of the stages.
At this point I think we are at the beginning of stage 4. First sign of this is a lower low. Market sentiment is echoing my thoughts. Keep in mind predictions do not make money in the market. You need a solid system of risk management and signs.
If the past is indicative of what's to come, (yes humans seem to act the same way over and over and over again in the market) we should try to learn from it. Below is the S&P 500 from 2007-2009. If you can't remember this was the start of the new trend and a bear market that had people running in the streets.
There was a new low put in, in January of 2008, (think December of 2018). There was an initial bounce to resistance, which failed and sent us back to the lows. From there, it bounced up towards resistance and began to act like it wanted to go higher. Once this failed it was game over. And we all experienced one of the biggest financial crisis of our lifetimes.
Am I saying this is definitely going to happen? No. I do not have a crystal ball. This is what COULD happen. And something I am preparing for if the market acts the way I expect it to. If it does, there could be a very nice risk/reward type set-up in the coming months if you do want to short the market. I won't hesitate if the market shows the right signs. Avoiding garbage while the market plays out is also key. If we are in the midst of a new trend or bear market this is what I expect over the next few months, maybe until May or June.
The market would create a bear flag over the next few months as it digests this big move from highs. Then a look of a move higher would surface, before coming right back into range and flushing out. Don't use this post as an expectation, rather a preparation for what could happen.
I learned my technical analysis from Kunal Desai at Bulls on Wall Street. For more on market cycles, check out Accumulation Phase, Run-Up Phase, Distribution Phase, Run-Down Phase.
Monday, January 14, 2019
Thursday, January 3, 2019
UVXY
Didn't want to pass this up without taking a stab. Market looks inverted from this. Will add over $85 if it gets there. Stop $80
Sunday, December 2, 2018
Watch-List 12/3/2018
Market has that look of a W type bottom. Back over 200ma would get bulls in control. Wednesday had some news that initiated this rally. Let's see if it is for real.
Wednesday, November 14, 2018
Swing Trades
Here is the link where I post my swing trades. I try to post trades on twitter if I can and the price is close to entry. Follow here if you would like.
https://docs.google.com/spreadsheets/d/1ppy-IfrLn0OanavwD9D0Ojc8ZptW_2s8y-zTFMlb4sk/edit?usp=sharing
Wednesday, August 8, 2018
Watchlist 8/9/2018
Been a while but getting back into the swing of things with trading in my life.
Overall market healthy and testing all time highs. I expect either a pullback or consolidation over the next few days at these levels and recent run. Make sure to check time frames of my charts. Some are daily some are weekly.
Wednesday, June 21, 2017
Oil Review 6/21/2017
Every Wednesday lately, I have put my entire focus on crude or CL. Inventory numbers are released at 10:30 EST and it causes reaction out of the market. I had short on the brain since that has been the trend lately. The above picture shows you the levels above. Although I did not label it on this chart, 43 was obvious support.
Lets take a look at the 5 minute chart. Granted I used a 15 minute chart for my entry but this tells a better story.
The numbers are released and crude rockets up 40 cents within seconds. It broke its 43.80 pivot but ran right into resistance above. It tried to flag above the pivot but the selling was too much. Once it got back under 43.80 I knew it was on. I took a short with a stop above 43.90ish. I had a 43.00 target. Amazingly, it knifed thru this area like butter. This is momentum. Had there been no news, I am sure 43 had a better chance to hold.
The reason why there was this big of a move, was a failed move higher, and MOMENTUM. The selling pressure was great because of news. I was predicting a move to $43. Momentum made it collapse even further. I hate to use the word predict, because that is not trading. Riding momentum is.
This reversal set up is my favorite thing to trade. Super low risk, and sometimes you hit a home run. These don't always happen, but it worked because of no support underneath 43 and additional momentum caused by a failed move.
Find the momentum, find your trade.
Subscribe to:
Posts (Atom)