My trading plan
Swing Trading:
My entries come from the pullback/flag set-up and a reversal set-up at a support or resistance.
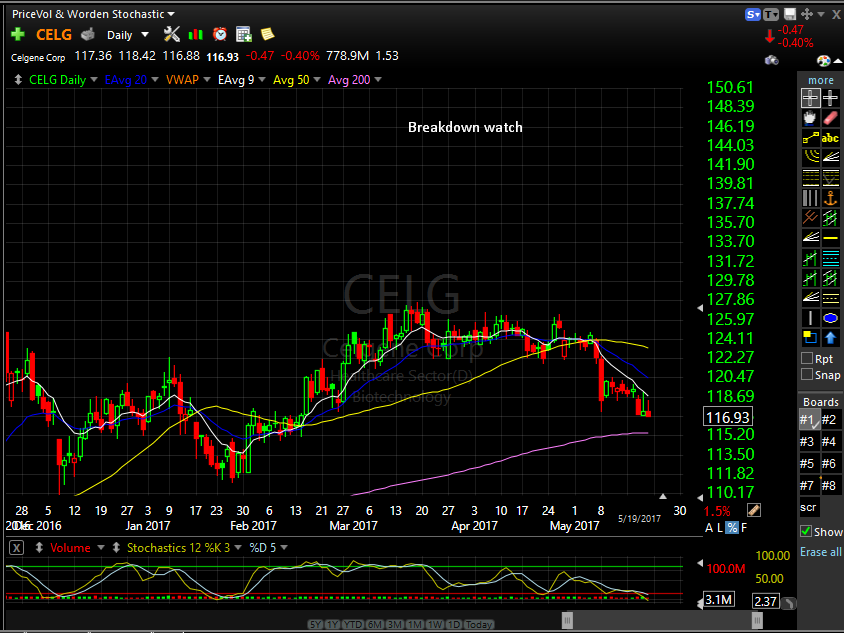
The pullback set-up is when the stock corrects via price. This would be when a stock breaks a key level for a period of days and revisits the upper portion of this price level.
A few examples of this would be:
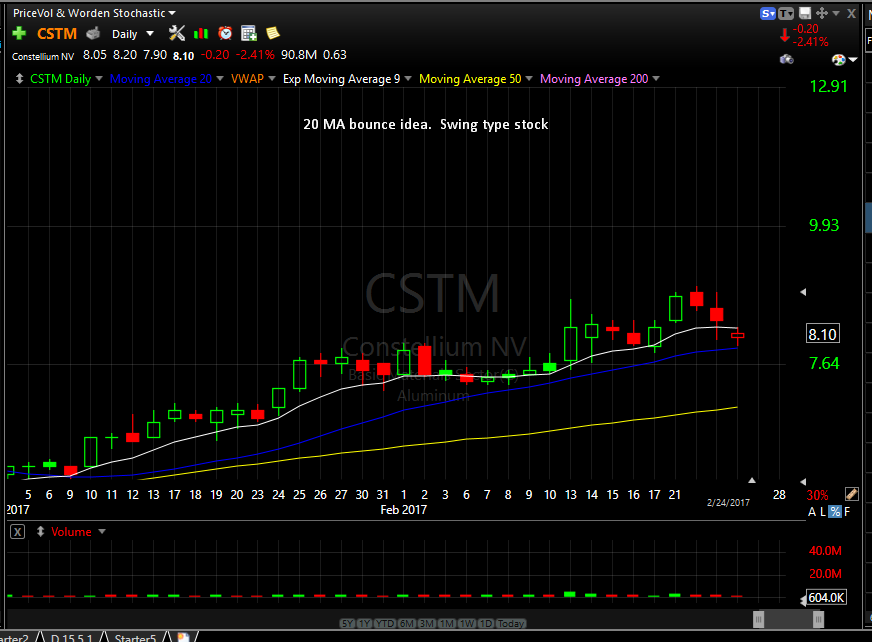
Price can also correct via time. This would consist of a longer flag pattern using key moving averages as guides. Key short term moving averages that I use are the 9 and 20 daily exponential moving averages. Followed by the medium 50 day moving average and the 200 day moving average. For the most part, my entries come from the 9 and 20 emas. These are the most important to gage the short term momentum.
My all-time favorite, nicknamed the Red Dawg Reversal, is a test of a previous support or resistance that knifes through, and quickly recovers. This offers a very low risk with high reward. The average r/r is about 5 to 1 but I have gotten upwards of 20 to 1 with my last shares.
Day trading:
Although the list taught to me is lengthy, I mainly focus on one intraday set-up. That is the pullback set up. On occasion, I will take an opening range break-out or a red to green trade if the chart is that good.
Before getting into the intraday set-ups, it is important to go over the stock selection. A random stock will act just that, randomly. A stock has to have the room and momentum to move “correctly” By this I mean, there should be room on the chart for the stock to move. There should be no or limited overhead resistance or underlying support. Examples of this would be a daily breakout/breakdown of a key pivot level or a stock gapping up/down on news or earnings. These two things bring momentum into a stock and act the way I was taught. This is the art of aligning on multiple time frames. I use the daily and 30 minute chart to identify key levels and the 5 and 15 minute chart to time entries.
The same general rules apply to day trading the pullback set up as it does with swing trading. The only big difference is VWAP is used. After the stock’s initial thrust, I look for a pullback/consolidation using key moving averages to time entires. I wait for a candle or wick to confirm that support or resistance has held and use the bottom of the candle or wick as my stop out.
Below are a few examples:
Gapper example:
Breakdown example:
Breakout example:
Opening range break:
Red to green: