Sunday, December 2, 2018

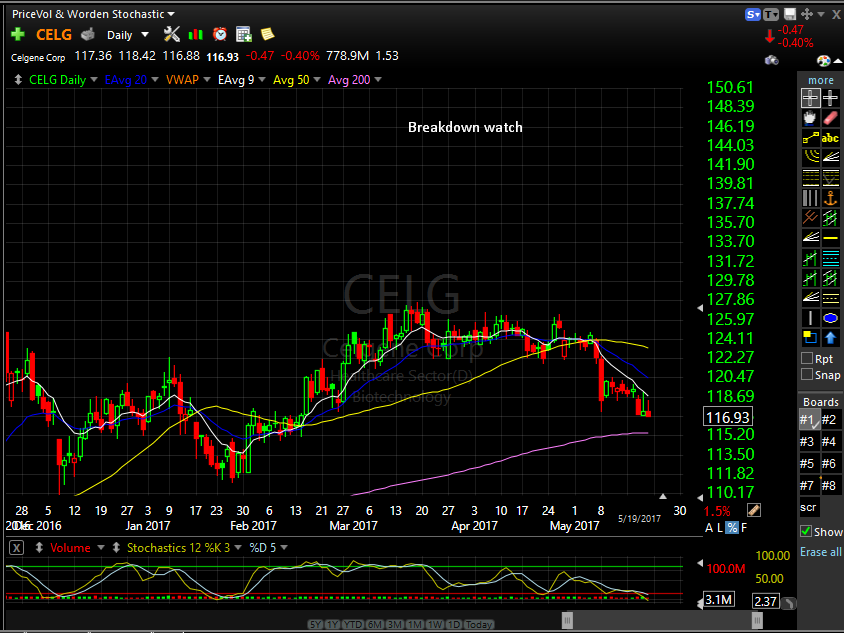
Watch-List 12/3/2018


Market has that look of a W type bottom.  Back over 200ma would get bulls in control.  Wednesday had some news that initiated this rally.  Let's see if it is for real.


Wednesday, November 14, 2018

Swing Trades

Here is the link where I post my swing trades.  I try to post trades on twitter if I can and the price is close to entry.  Follow here if you would like. 


https://docs.google.com/spreadsheets/d/1ppy-IfrLn0OanavwD9D0Ojc8ZptW_2s8y-zTFMlb4sk/edit?usp=sharing

Wednesday, August 8, 2018

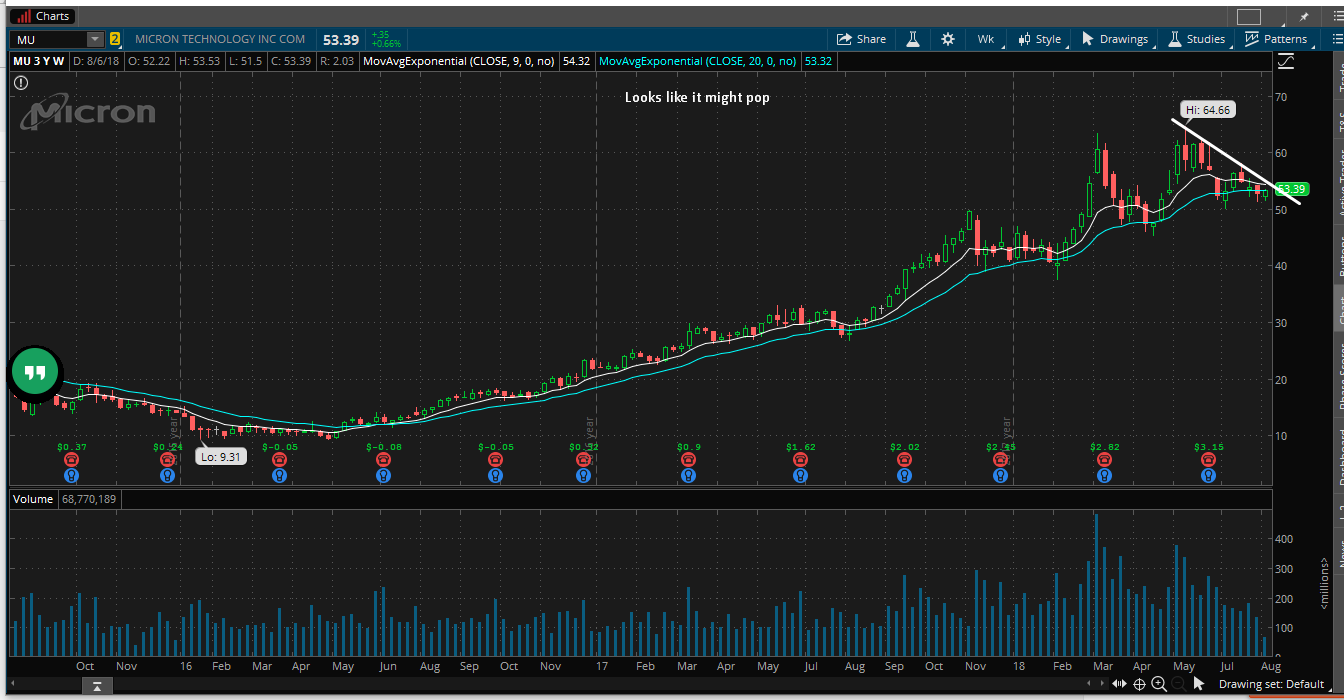
Watchlist 8/9/2018

Been a while but getting back into the swing of things with trading in my life. 


Overall market healthy and testing all time highs.  I expect either a pullback or consolidation over the next few days at these levels and recent run.  Make sure to check time frames of my charts.  Some are daily some are weekly. 


Wednesday, June 21, 2017

Oil Review 6/21/2017


Every Wednesday lately, I have put my entire focus on crude or CL.  Inventory numbers are released at 10:30 EST and it causes reaction out of the market.  I had short on the brain since that has been the trend lately.  The above picture shows you the levels above.  Although I did not label it on this chart, 43 was obvious support.

Lets take a look at the 5 minute chart.  Granted I used a 15 minute chart for my entry but this tells a better story.


The numbers are released and crude rockets up 40 cents within seconds.  It broke its 43.80 pivot but ran right into resistance above.  It tried to flag above the pivot but the selling was too much.  Once it got back under 43.80 I knew it was on.  I took a short with a stop above 43.90ish.  I had a 43.00 target.  Amazingly, it knifed thru this area like butter.  This is momentum.  Had there been no news, I am sure 43 had a better chance to hold.

The reason why there was this big of a move, was a failed move higher, and MOMENTUM.  The selling pressure was great because of news.  I was predicting a move to $43.  Momentum made it collapse even further.  I hate to use the word predict, because that is not trading.  Riding momentum is.

This reversal set up is my favorite thing to trade.  Super low risk, and sometimes you hit a home run.  These don't always happen, but it worked because of no support underneath 43 and additional momentum caused by a failed move.

Find the momentum, find your trade.


Wednesday, April 19, 2017

Revised Trading plan as of 4/16/2017

My trading plan

Swing Trading:

My entries come from the pullback/flag set-up and a reversal set-up at a support or resistance.

The pullback set-up is when the stock corrects via price.  This would be when a stock breaks a key level for a period of days and revisits the upper portion of this price level.  

A few examples of this would be:


Price can also correct via time.  This would consist of a longer flag pattern using key moving averages as guides.  Key short term moving averages that I use are the 9 and 20 daily exponential moving averages.  Followed by the medium 50 day moving average and the 200 day moving average.  For the most part, my entries come from the 9 and 20 emas.  These are the most important to gage the short term momentum.


My all-time favorite, nicknamed the Red Dawg Reversal, is a test of a previous support or resistance that knifes through, and quickly recovers.  This offers a very low risk with high reward.  The average r/r is about 5 to 1 but I have gotten upwards of 20 to 1 with my last shares.


Day trading:

Although the list taught to me is lengthy, I mainly focus on one intraday set-up.  That is the pullback set up.  On occasion, I will take an opening range break-out or a red to green trade if the chart is that good.

Before getting into the intraday set-ups, it is important to go over the stock selection.  A random stock will act just that, randomly.  A stock has to have the room and momentum to move “correctly”  By this I mean, there should be room on the chart for the stock to move.  There should be no or limited overhead resistance or underlying support.  Examples of this would be a daily breakout/breakdown of a key pivot level or a stock gapping up/down on news or earnings.  These two things bring momentum into a stock and act the way I was taught.  This is the art of aligning on multiple time frames.  I use the daily and 30 minute chart to identify key levels and the 5 and 15 minute chart to time entries.

The same general rules apply to day trading the pullback set up as it does with swing trading.  The only big difference is VWAP is used.  After the stock’s initial thrust, I look for a pullback/consolidation using key moving averages to time entires.  I wait for a candle or wick to confirm that support or resistance has held and use the bottom of the candle or wick as my stop out.  

Below are a few examples:

Gapper example:


Breakdown example:

30 minute:  http://prnt.sc/caei4z

Breakout example:


Opening range break:


Red to green: